At the outset I wish in advance all the BEST 2022 to my blog readers and followers.
This post is a continuation of my earlier post titled ”Discover Your Stock Price Chart”.
This post is pertaining to price discovery of stocks that one intends to invest or already invested .My research study does not aim to forecast highs/lows/support/resistances.
My approach is very basic. That is, any asset undergoes a Price Trending and Time Trending cyclical patterns. Stock clearing or settlement dates both weekly and monthly and stock options and Futures positions ,ceiling on price circuit and trade limit (trade Bans)from time to time (imposed by NSE) and so on too affect prices impacting overbought and over sold positions in the market besides market news and rumors. At the end of the day “price’ is the king of market and it is democratic to all category of buyers and sellers of stocks.
Regarding stock price trending , I feel TIME prediction for a particular target is met with difficulties or only a guessing game. Of course to measure the price Trending Pattern is possible to some extent.
I recall here the words of Benjamin Graham “The best way to measure your investing success is not by whether you’re beating the market but by whether you’ve put in place a financial plan and a behavioral discipline that are likely to get you where you want to go.”
“The intelligent investor is a realist who sells to optimists and buys from pessimists.”
Based on my research on the subject I thought why don’t I come out with a Price Forecast Model on this 2022 New Year’s eve. (just for education purpose)
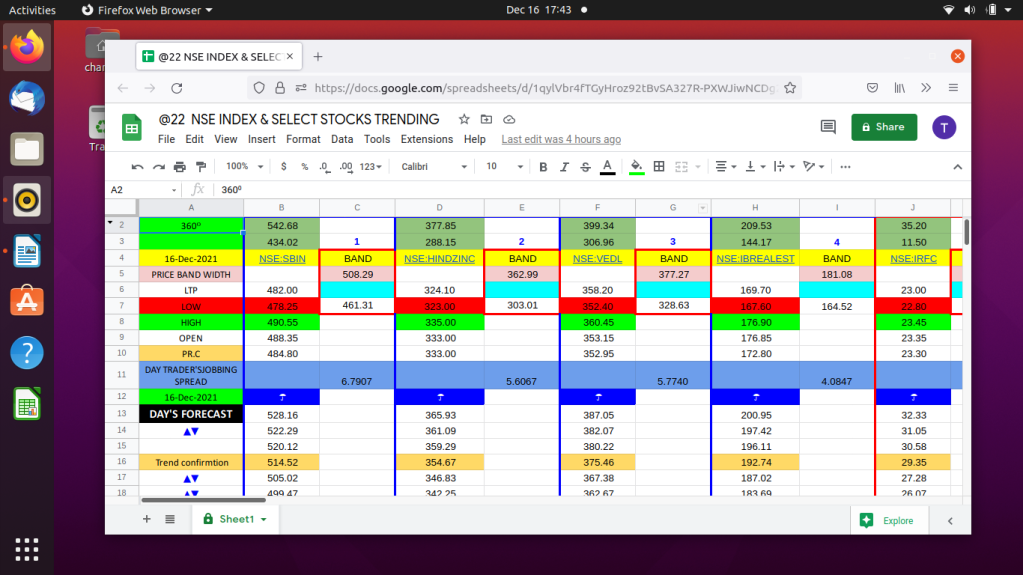
I have applied my calculation matrix to 22 stocks(randomly selected) quoted in NATIONAL STOCK EXCHANGE (INDIA) . This approach could be extended to many more stocks and INDICES.
How do we go about it?
The Google Sheet reference given below here gets updated daily . Any investor or trader wishing to take positions should mind the price circle of 360 degree movement for stocks bought/sold on that particular day. The chart also forecast a price divergence BAND to know the direction of price movement. The price fluctuations are calculated on daily basis. It is not static but it is dynamic!.
This price model forecast aims at day’s key price,Up trend ,down trend deciding and confirming price points to understand when to get into or continue or when to get out of a particular price either booking profit or loss during particular trading period as decided by the investor.
Price forecast table presented here is suited for all types of stock market players both on short, on long term basis and also for day traders too. Day traders can do jobbing by adding /deducting price spread calculated with day’s opening price or previous day’s close price. (for education purpose only)
The cardinal logic that I want to tell here is that the day you purchase a stock you come under the day’s PRICE CYCLE, that is forecast ed and presented here. You have to follow that day’s price table data only till you get out of it. That is your PRICE CHART.(for education purpose only)
My doubtful question is that how can a omnibus model of common price deciding point be applicable to all investors of a particular stock at one shot either to enter or to exit the stock with various price point indicators for the price fluctuations occur during a set period of time?
My moot question is how can you ignore multiplier price cycles occur on a particular time period?
Here,I wish to recall the words of Norman Ralph Augustine” If stock market experts were so expert, they would be buying stock, not selling advice”.”Simple systems are not feasible because they require infinite testing.
I still don’t understand who is a real investor.Is it true? In the context of proliferation of application technology and circulation of whirl wind of information,anyone with fat salary package who belongs to the category of new age employees with Stock APPS in hand or retired pensioner?
In my next post I will come out with a Price Forecast model for 22 NASDAQ quoted Stocks.
Happy Trading ! Happy Investments 2022
https://docs.google.com/spreadsheets/d/1qylVbr4fTGyHroz92tBvSA327R-PXWJiwNCDg24l1hE/edit#gid=0

Happy 2022 to you!
LikeLike
Bright 2022🎉 to you
LikeLiked by 1 person